

Search Console tells you what Google decided to show you. Your server log tells you what Googlebot actually did on your site, line by line, with no summary and no delay.
If you run a clinic website, you probably have never opened that file. Someone told you it is technical, expensive to analyze, or something only enterprise teams read. None of that is true. The log is a plain text file, and a free command-line tool reads it.
I use server logs to answer one question first on every healthcare audit: is Google reaching the pages that bring in patients? In the next ten minutes you will pull a log, filter it to Googlebot, verify the visitor is real, and read the five numbers that matter, without paying for a SaaS tool.
What Is a Server Log File and Why Does It Matter for a Clinic Website?
A server log file is a text record of every request made to your website, one line per request. It shows who asked, when, for which URL, and what your server answered.
Think of the log as the front-desk visitor sign-in sheet. Search Console is the weekly summary email. The sheet records every name, every time, every room visited. When a patient says “I never got a call back,” you check the sheet.
What Does a Single Log Line Look Like?
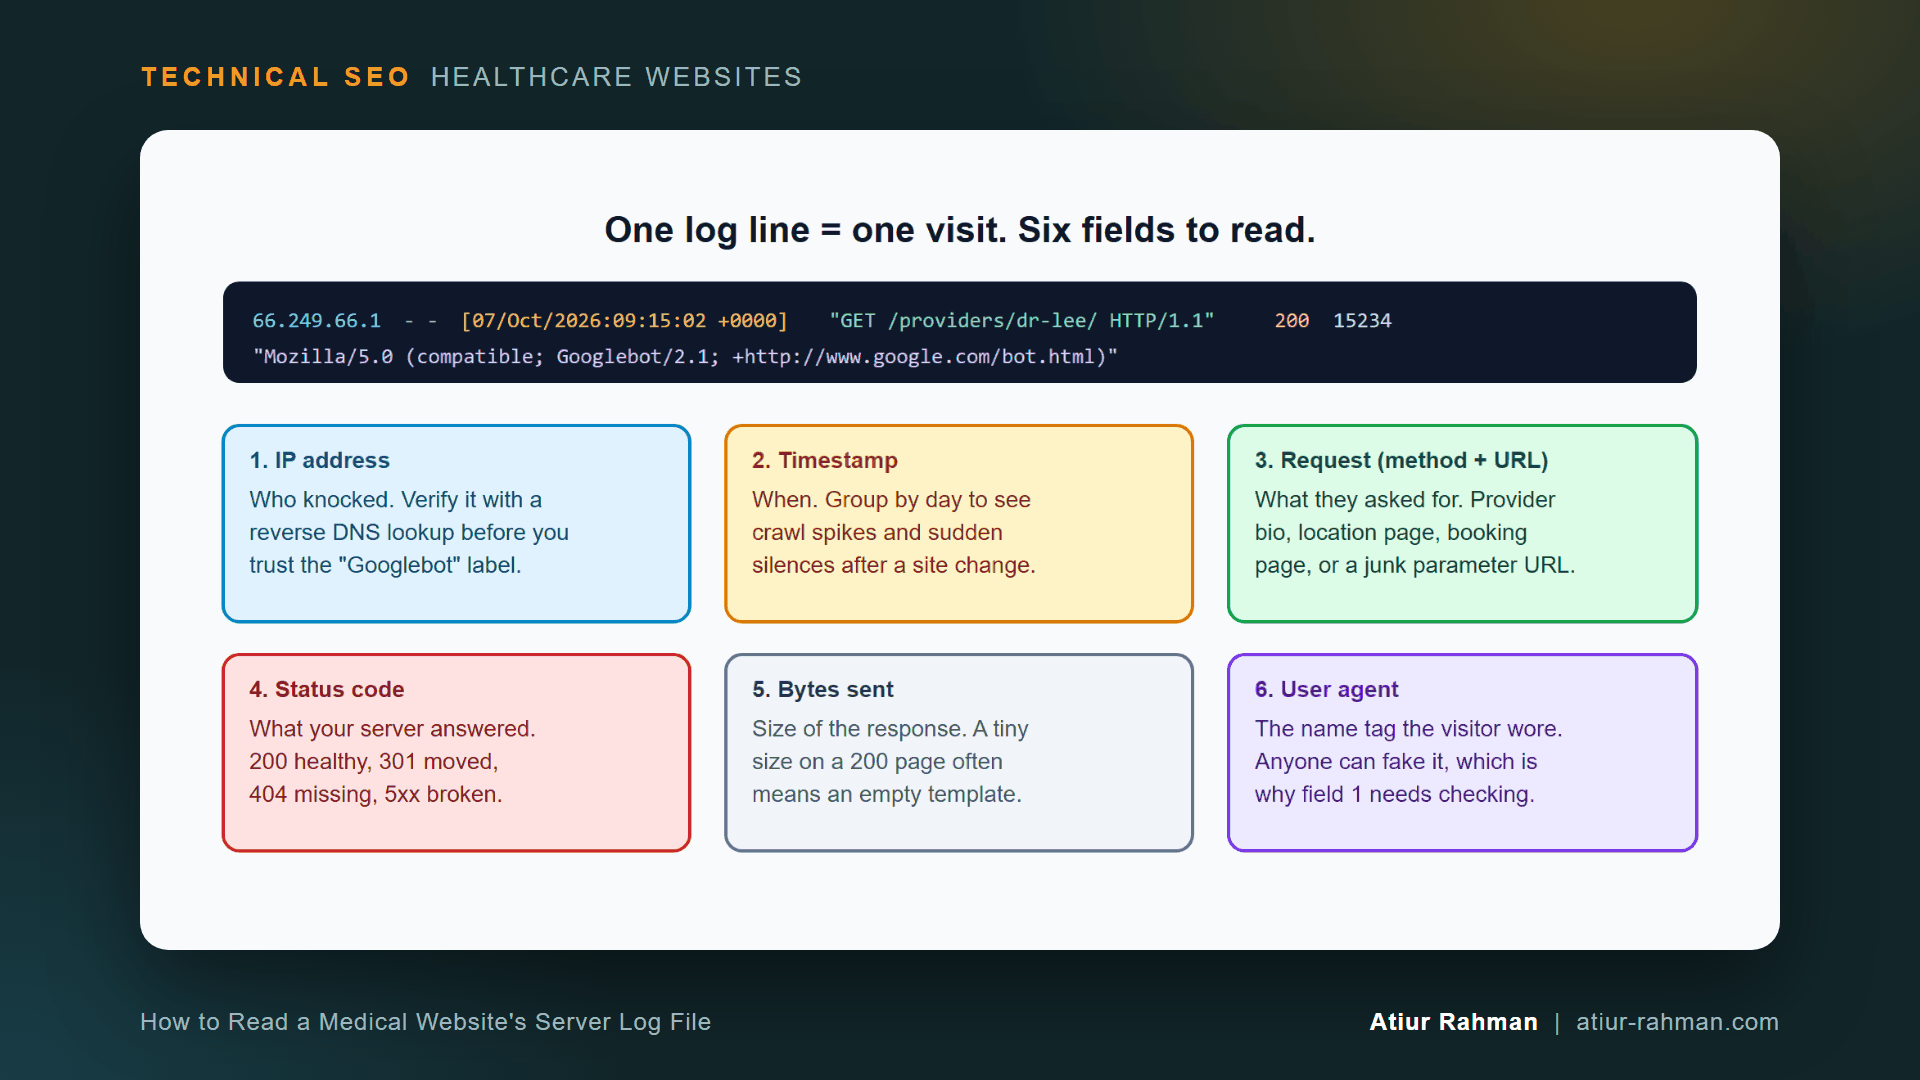
A log line holds six fields you need: IP address, timestamp, request, status code, bytes sent and user agent.
66.249.66.1 - - [07/Oct/2026:09:15:02 +0000] "GET /providers/dr-lee/ HTTP/1.1" 200 15234 "-" "Mozilla/5.0 (compatible; Googlebot/2.1; +http://www.google.com/bot.html)"
Read it left to right. A visitor at 66.249.66.1 requested /providers/dr-lee/, and your server answered 200 with 15,234 bytes. The user agent says Googlebot. This layout is the Apache “combined” format, and Nginx uses the same one by default. The Apache documentation describes every field in mod_log_config.
How Do I Get My Server Log File From My Hosting Provider?
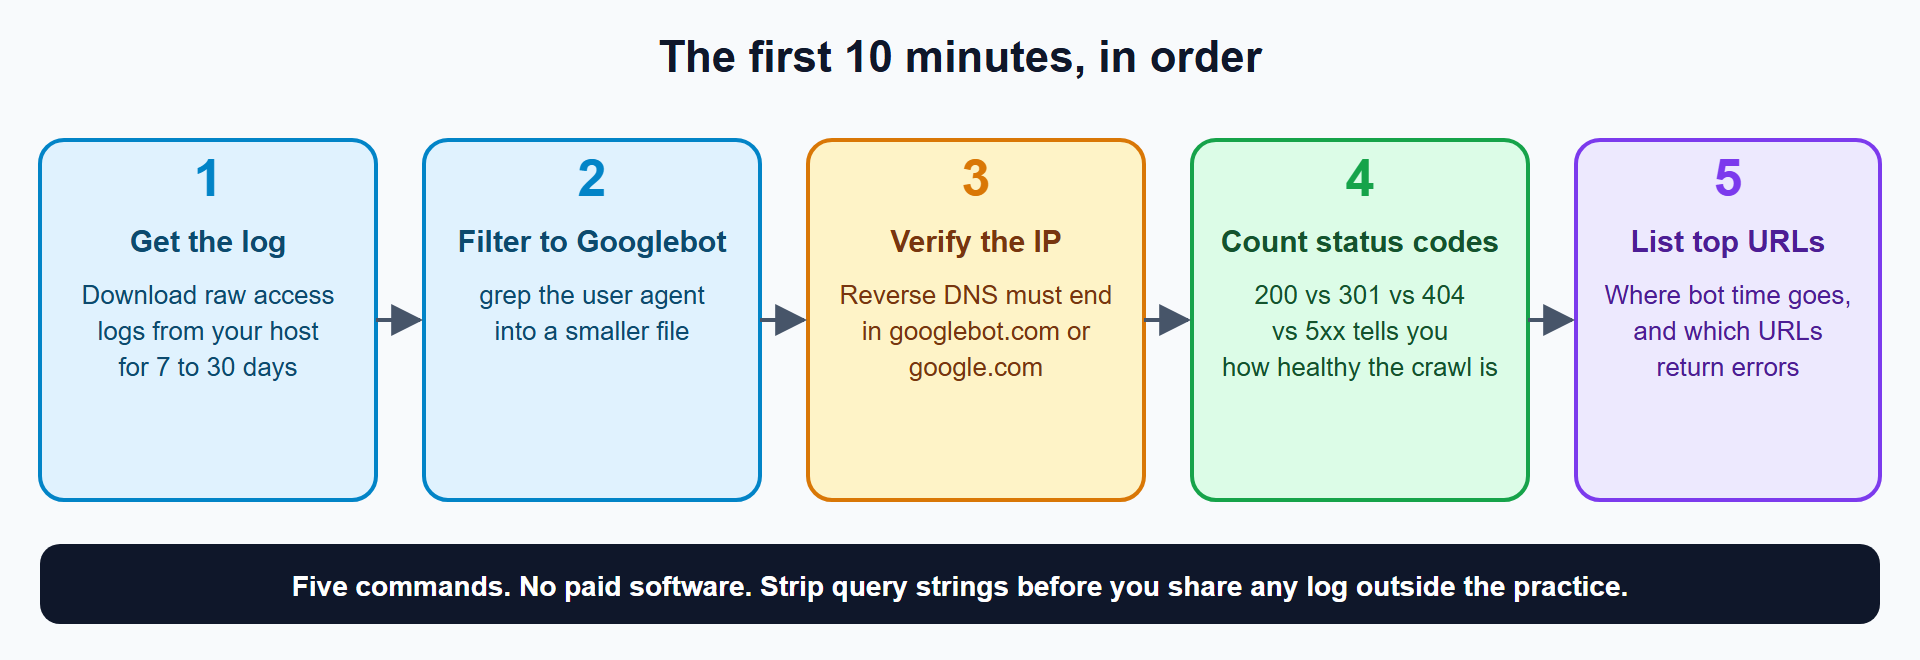
Download the raw access log from your hosting control panel, or ask your host’s support team for it. Pull 7 to 30 days.
On shared hosting with cPanel, look for Metrics → Raw Access and download the compressed file for your domain. On managed WordPress hosts, the log sits in the dashboard or behind a support request. A host that says “we don’t provide logs” still stores them. Ask for “raw HTTP access logs for the last 30 days” in those words.
Can Server Logs Expose Patient Information?
Yes. Query strings travel inside the request field, and forms, search boxes and booking links sometimes put names, emails or appointment IDs in the URL. Strip query strings before you share a log with anyone outside the practice.
sed -E 's/?[^" ]*//g' access.log > access-clean.log
Run your analysis on the clean copy. Delete the raw file once you finish. Ask your compliance contact whether your hosting agreement covers log storage.
How Do I Filter a Server Log to Show Only Googlebot?
Use grep to copy every line containing “Googlebot” into a smaller file. Compressed logs open with zgrep.
# Uncompressed log
grep -i "googlebot" access-clean.log > googlebot.log

# Compressed log (.gz)
zgrep -ih "googlebot" access-clean.log.gz > googlebot.log

# How many Googlebot requests?
wc -l googlebot.log
The result is every request that claims to come from Googlebot. Claims are cheap. The next step checks them.
How Do I Verify a Visitor Is the Real Googlebot?
Run a reverse DNS lookup on the IP, then a forward lookup on the name it returns. The real Googlebot resolves to a name ending in googlebot.com or google.com, and the forward lookup returns the original IP.
# List your most frequent Googlebot IPs
awk '{print $1}' googlebot.log | sort | uniq -c | sort -rn | head -5

# Reverse lookup, then forward lookup
host 66.249.66.1
host crawl-66-249-66-1.googlebot.com
Google documents this method, plus its published IP range files, in Verifying Googlebot. Scrapers fake the user agent constantly. An IP that fails the check is not Google, and you can ignore its lines.
What Do I Look For in the First 10 Minutes of Log Data?
Look at five things: status code mix, most-requested URLs, error URLs, parameter URLs and daily volume. Each takes one command.
Which Status Codes Is Googlebot Getting From My Server?
Count the status codes in the ninth field.
awk '{print $9}' googlebot.log | sort | uniq -c | sort -rn
Example output (format only; your numbers differ):
 8412 200
  690 301
  233 404
   41 500
Most hits return 200. A steady share of 301 is normal. 404 on retired URLs needs a redirect or a decision. 5xx hits sit near zero on a healthy server. Any cluster of 500 or 503 errors means Googlebot hit a server that failed. Google states that 5xx and 429 errors prompt its crawlers to temporarily slow down, in its HTTP status code and network error guidance.
Which Pages Is Googlebot Spending Its Time On?
List the top requested URLs from the seventh field.
awk '{print $7}' googlebot.log | sort | uniq -c | sort -rn | head -20
Compare the list with the pages that earn appointments. If your top 20 holds /wp-login.php, /?s= search results and calendar URLs instead of provider and service pages, Googlebot spends its visits in the wrong rooms.
Which URLs Return 404 to Googlebot?
Filter to status 404 and count by URL.
awk '$9 == 404 {print $7}' googlebot.log | sort | uniq -c | sort -rn | head -20
On clinic sites these are usually retired provider bios, old service pages from a redesign and misspelled links in emails. Each frequent one deserves a 301 to the closest live page, or a deliberate 404 if no replacement exists.
Is Googlebot Stuck in My Appointment Calendar?
Count how many requests carry a query string, then list the heaviest parameter patterns. Run this on the raw (not cleaned) copy of the Googlebot lines only, and keep the output inside the practice.
awk '$7 ~ /?/ {print $7}' googlebot.log | sed -E 's/=[^&]*/=*/g' | sort | uniq -c | sort -rn | head -10
A booking calendar that links to ?date= for every day of every month builds an endless URL trail. Googlebot follows it. Each of those requests is a visit not spent on a provider page. I cover the fix for this pattern in The Faceted Navigation Audit Framework I Use Before Touching robots.txt.
How Many Times Per Day Does Googlebot Visit?
Count requests per day, in date order.
awk '{print substr($4,2,11)}' googlebot.log | uniq -c
Watch for a sudden drop to near zero. A firewall update, a new security plugin or a server outage produces exactly that shape, and Search Console reports it days later.
What Do the Log Findings Mean and Who Fixes Them?
Match each finding to an owner so nothing sits in a queue.
| Log finding | What it means | Owner |
|---|---|---|
Many 404 hits on old provider URLs | Redesign left no redirects | Developer + technical SEO |
5xx clusters at certain hours | Server or plugin failure under load | Developer / host |
Heavy hits on /wp-login.php or /?s= | Bot time wasted on low-value URLs | Technical SEO |
Endless ?date= or filter URLs | Calendar or filter crawl trap | Developer + technical SEO |
No Googlebot hits on /locations/ for 30 days | Pages undiscovered or deprioritized | Technical SEO |
| Fake Googlebot IPs failing reverse DNS | Scrapers, not Google | Host / security |
| Googlebot requests drop to near zero overnight | Firewall, robots.txt or outage | Developer + host |
What Do I Say When My Host or Developer Pushes Back?
Hosts say the log is large, developers say Search Console covers it, and both are partly right. The log is large, so ask for 7 to 30 days instead of a year. Search Console covers summaries. It does not show every URL Googlebot requested, which is the part you need.
Frame the request as a ten-minute diagnostic that costs nothing. Offer to send only the Googlebot lines, with query strings removed. That removes the privacy objection and the file-size objection together.
How Do I Add Response Time to My Server Log?
Add a response-time field to your log format, because the default combined format does not record how long your server took. Apache uses %D (microseconds) and Nginx uses $request_time (seconds), per the Apache log format reference and the Nginx log module.
# Apache: append %D to the combined format
LogFormat "%h %l %u %t "%r" %>s %b "%{Referer}i" "%{User-agent}i" %D" combined_time
# Nginx: append $request_time
log_format timed '$remote_addr - $remote_user [$time_local] "$request" '
                 '$status $body_bytes_sent "$http_referer" '
                 '"$http_user_agent" $request_time';
Shared hosting often locks this file. When you cannot change it, ask your host to enable it. Once the field exists, the last column becomes your slow-page finder.
Can I Read Logs in Excel Instead of the Command Line?
Yes. Open the cleaned Googlebot file through Data → From Text/CSV, choose Space as the delimiter and a double quote as the text qualifier. The IP, status code, bytes and URL land in separate columns, and you build a pivot table on the status column.
Expect the date to split into two columns because of the square bracket. Delete the extra column, or rebuild the date with a formula. Excel stops around 1,048,576 rows, so the clean Googlebot file is the right input, not the full log.
Reusable asset: the commands in this article work in a plain spreadsheet too. Import the cleaned Googlebot file and pivot on the status column.
What Do I Do This Week?
- ☐ Download 30 days of raw access logs.
- ☐ Strip query strings into a clean copy.
- ☐ Filter to Googlebot and verify the top five IPs.
- ☐ Count status codes and list the top 20 URLs.
- ☐ List the top 20
404URLs and assign a redirect or a decision to each. - ☐ Check for calendar and search parameter URLs.
- ☐ Ask your host to add a response-time field.
Related reads in this hub:
- What Does Technical SEO Control on a Medical Website (and What Can’t It Fix)?
- Crawling vs. Indexing vs. Ranking: Why a Blocked Clinic Page Still Shows in Google
Frequently Asked Questions
Where Do I Find Server Logs on cPanel or Shared Hosting?
Open cPanel and look under Metrics for Raw Access. Download the compressed file for your domain. If the option is missing, open a support ticket and ask for raw HTTP access logs for the last 30 days.
Is Search Console’s Crawl Stats Report Enough Instead of Server Logs?
No. The Crawl Stats report summarizes Google’s own requests: totals, response codes, file types and average response time. It does not list every URL, and it ignores other bots. Logs give URL-level detail. Use both.
How Many Days of Server Logs Do I Need?
Seven days shows the pattern, and thirty days shows the trend. Pull 30 when you can. A single day misleads because Googlebot’s visits vary from day to day.
Does a Small Clinic Website With 50 Pages Need Log Analysis?
Not for crawl budget. Google’s crawl budget guide targets very large or fast-changing sites. A 50-page site still gains from a one-time log check, because 404s, server errors and firewall blocks show up there first.
Can Someone Fake Googlebot in My Logs?
Yes. Any scraper can send a Googlebot user agent. Only the reverse DNS check, or a match against Google’s published Googlebot IP ranges, proves a request came from Google.
How Do I Know the Log Contains Patient Data?
Search the raw file for an email pattern, then remove query strings before sharing.
grep -E -c "[A-Za-z0-9._%+-]+@[A-Za-z0-9.-]+.[A-Za-z]{2,}" access.log
Any count above zero means personal data sits in your URLs. Fix the form or link that puts it there, and keep the log inside the practice.
Facing unexplained indexation drops or broken booking funnels on your clinic website? Book a 30-minute technical consultation with Atiur.
Part of the Technical SEO for Healthcare Websites series. More guides are on the blog. Related case study: Fixing the Faceted Navigation That Was Eating a Pharmacy Catalog’s Crawl Budget.
References
- Google Search Central, Verifying Googlebot and other Google crawlers
- Google Search Central, Googlebot IP ranges (googlebot.json)
- Google Search Central, HTTP status codes, network and DNS errors
- Google Search Central, Managing crawl budget for large sites
- Google Search Console Help, Crawl Stats report
- Apache HTTP Server, mod_log_config
- Nginx, ngx_http_log_module