

Open the Landing pages report in Google Analytics 4 and read the Key events column. A column of zeros means one of two things: nobody takes action, or nobody is counting.
Most clinics skip that check and jump to a fix. A redesign, a new agency, more blog posts. Each one is a guess made before anyone located the problem. A website that gets traffic and no appointments has one of three problems, and each shows up in a different number.
This guide gives you the three numbers, the order to read them in and what each reading points to. They come from reports you already have: GA4, Search Console and your phone system. By the end you’ll know whether the problem is who visits, what visitors do or what happens after they act. I run Local SEO and conversion audits for medical practices, and I read these numbers in this order on every account.
Which Three Numbers Explain Why Visitors Don’t Book?
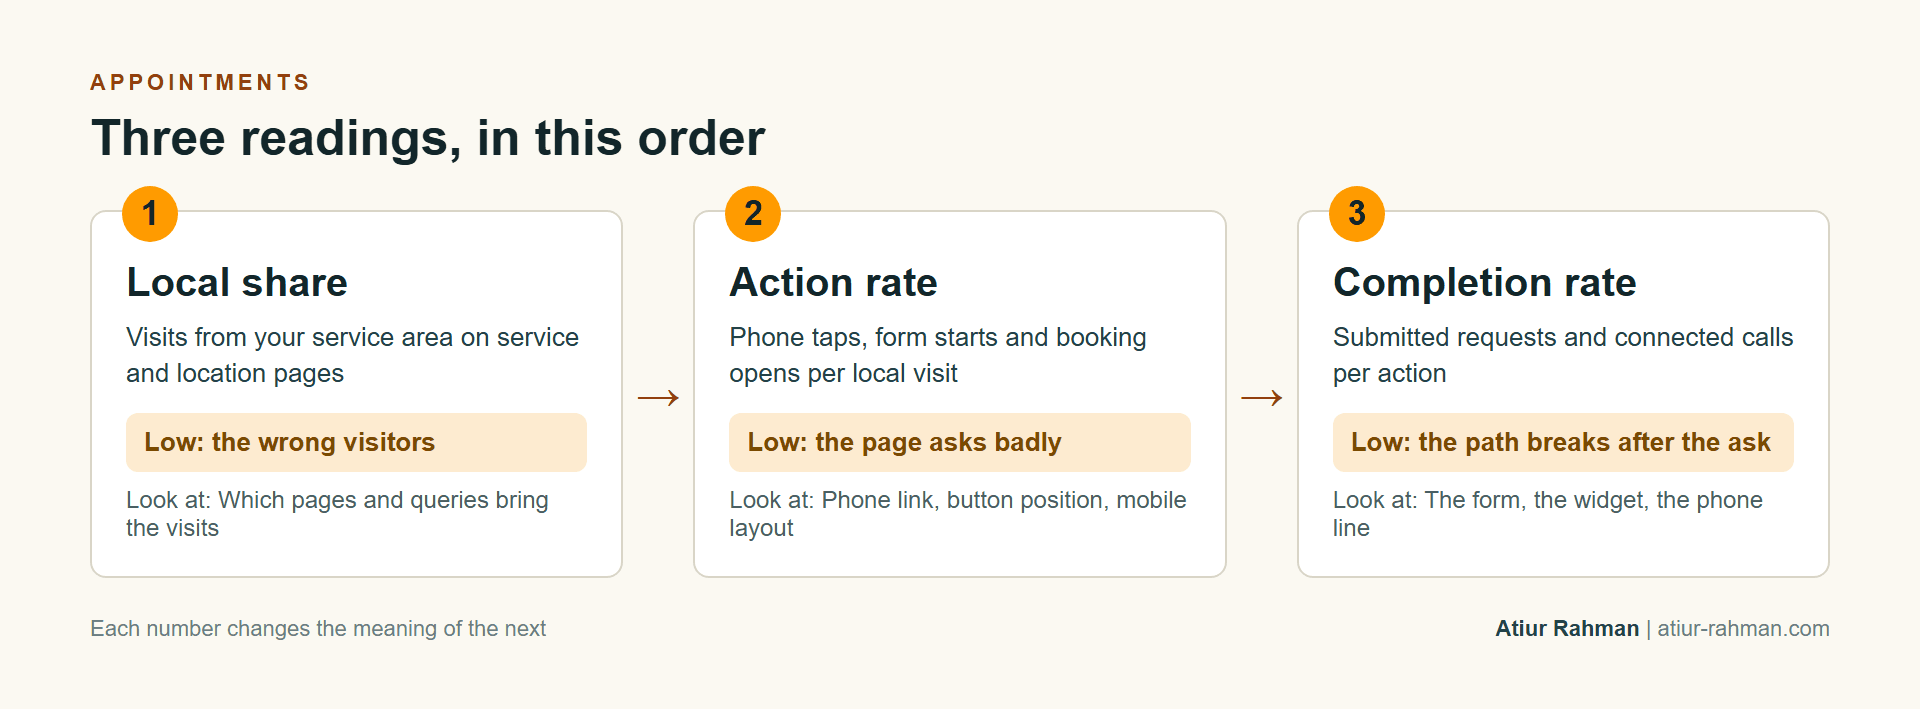
Three ratios explain it. Local share is the portion of visits to your service and location pages that come from your service area. Action rate is the portion of those visits that tap the phone number, start a form or open booking. Completion rate is the portion of actions that end in a submitted request or a connected call. A low local share means the wrong visitors. A low action rate means the page asks badly. A low completion rate means the path breaks after the ask.
The order matters because each number changes the meaning of the next. A weak action rate on a page full of out-of-state readers says nothing about the page. A weak completion rate on a healthy action rate says the problem lives in the form, the widget or the front desk.
| Reading | How to calculate it | A low number points to | First place to look |
|---|---|---|---|
| Local share | Sessions from your service area on service and location pages, divided by all sessions on those pages | Traffic from the wrong places | Which pages and queries bring the visits |
| Action rate | Phone taps plus form starts plus booking opens, divided by local sessions | A page that doesn’t ask clearly | Phone link, button position, mobile layout |
| Completion rate | Submitted requests plus connected calls, divided by actions | A path that breaks after the ask | The form, the widget, the phone line |
How Do You Measure Local Share Without Guessing?
You measure it by splitting sessions by city or region on the pages that sell appointments, then comparing that split with the area you serve. The measure belongs on service and location pages, not on the whole site, because a popular blog post can pull readers from everywhere without hurting anything.
In GA4, open Reports, then User attributes, then Demographic details, and switch the dimension to City or Region. Add a page filter so only service and location URLs count. Search Console gives a second view: the Performance report filtered to those pages, with queries that contain your city or neighborhood names. Geography in analytics comes from IP addresses, so mobile carriers blur it. Region-level numbers are reliable, and city-level numbers are rough.
A low local share has a specific meaning. It says the pages rank for searches that people outside your area type. The fix sits in what the pages target, not in the buttons on them.
What Should a Medical Site Count as an Action?
Each deliberate step toward a patient counts as its own GA4 event: a phone tap, a form start, a form submit, a booking open and a booking confirmation. GA4 lets any event you collect become a key event, so the work is choosing which ones deserve that label.
| Event | Fires when | Key event? | What it does not prove |
|---|---|---|---|
| phone_click | A visitor taps a tel: link | Yes | That the call connected |
| form_start | A visitor enters the first field | Optional | Intent to finish |
| form_submit | The form returns its success message | Yes | That the request reached the practice, if the form sends email through a weak setup |
| booking_open | The scheduling widget loads or opens | Optional | That a time was chosen |
| booking_confirmed | The confirmation screen or widget callback fires | Yes | That the patient arrives |
Two traps cost clinics months. A phone tap isn’t a call, so I pair the tap count with the phone system’s call log. And some forms fire the submit event when the button is clicked, even if validation fails, which inflates completions. Google’s key events documentation explains how to mark events, and the DebugView tool shows an event firing as you test the form yourself.
Patient information stays out of the data. Event names and parameters carry no names, conditions or appointment details, and tracking on logged-in portal pages needs a privacy review by counsel before anyone adds it.
Where Do Forms and Booking Widgets Lose People?
They lose people in the gap between a start and a finish, and the gap is measurable by device. Compare form starts with submits, and booking opens with confirmations, then split every comparison into mobile and desktop.
A wide gap between form start and submit points to the form itself: too many required fields, errors that appear only on a phone, a captcha that fails, a field that rejects an insurance ID. A wide gap between booking open and booking confirmed points to the scheduling widget: account creation before times appear, confusing appointment types, a layout that cuts off the date picker. A healthy gap on desktop and a wide one on mobile says the page breaks on phones, which often connects to the speed and layout problems in the Core Web Vitals triage.
I fill this sheet monthly. The cells stay blank until you read your own reports:
| Device | Local sessions | Actions | Completions | Action rate | Completion rate |
|---|---|---|---|---|---|
| Mobile | actions ÷ sessions | completions ÷ actions | |||
| Desktop | actions ÷ sessions | completions ÷ actions |
Vendor guides quote average conversion rates, and they disagree with each other. Your own baseline, by device and by traffic source, beats any published average.
When Is the Problem After the Click?
It sits after the click when actions look healthy and completions don’t. At that point the website has done its job and the practice hasn’t: calls ring out, form requests wait a day, hours don’t match when patients try to book.
Two tests settle it in an afternoon. I submit a test request through the clinic’s own form and time the reply, then I call the main number at the busiest hour of the week and count the rings. A website audit finds neither problem, because neither lives on the website. They are staffing and process questions, and they cost appointments exactly like a broken button does. Automatic replies carry no clinical details, since they go to an unverified address.
Frequently Asked Questions
What conversion rate is normal for a medical practice?
No single number fits every specialty, traffic source and booking method. Published averages disagree, so I measure your own rate over time, by device, on service and location pages only. A rate that falls after a site change tells you more than a comparison with a stranger’s site.
Why does my form report more submits than my front desk sees?
The submit event is probably firing on the click instead of on success, or spam submissions are counting. I test by submitting a real request and checking that the event fires once, only after the success message.
Is a phone tap a booked patient?
No. A tap shows intent. The call may not connect, and the person may not book. Pair the tap count with call tracking or the phone system’s log to count connected calls.
Can I track bookings inside my patient portal?
Not without a privacy review. Logged-in pages can expose patient information to an analytics tool, so counsel approves any tracking there. Count the confirmation on the public side instead.
How long should I measure before changing the site?
Long enough for each device to show a pattern. A low-volume practice reads monthly totals, a busier one reads weekly. I change one thing at a time so the next reading means something.
Traffic is up and the schedule is not? Book a strategy call.
References
- Google Analytics Help, Key events overview
- Google Search Central, Page experience