

Your PageSpeed report is red, your developer has a list of 40 recommendations, and nobody can tell you which one matters. Meanwhile a patient on a phone in a waiting room taps your “Book Now” button and watches a blank space where the booking form belongs.
You do not have a 40-item problem. You have three, and most clinic sites share the same three: a hero image that loads late, a page that jumps while it loads, and third-party scripts that freeze the page when a patient taps. The long list is mostly noise.
I triage Core Web Vitals on healthcare sites with one rule: fix what real patients feel, in the order they feel it. In the next ten minutes you will learn how to read the right data, which fixes come first, and which popular optimizations you can safely skip.
What Are Core Web Vitals and What Counts as Good?
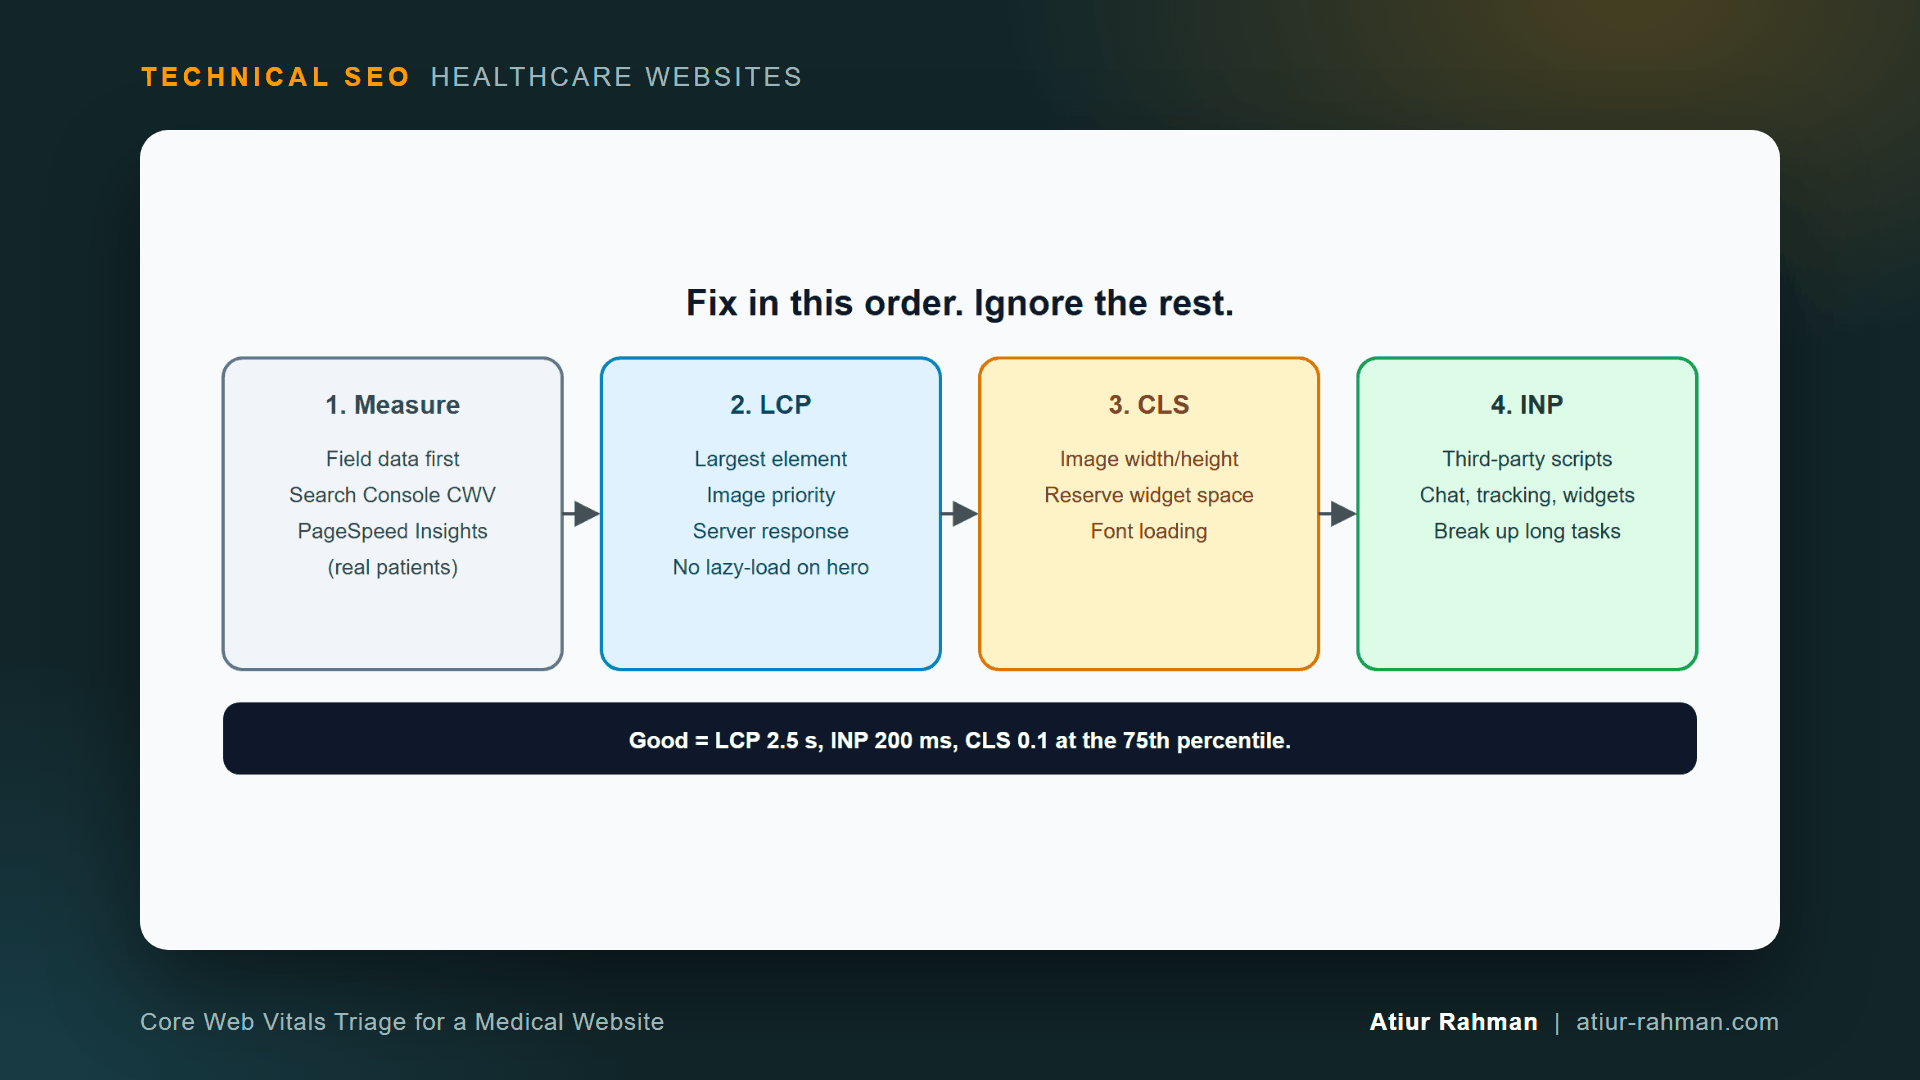
Core Web Vitals are three measurements of real-visitor experience: loading (LCP), responsiveness (INP) and visual stability (CLS). A page is good when LCP is within 2.5 seconds, INP is 200 milliseconds or less and CLS is 0.1 or less.
On a clinic site, each one has a patient-facing meaning. A slow LCP means a patient stares at a blank page before they see your phone number. A bad CLS means they tap “Call Now” and the button slides away. A bad INP means they tap “Select a time” and nothing happens for half a second.
Google says its ranking systems seek to reward good page experience, in its Core Web Vitals documentation. Speed helps a relevant page. It does not rescue an irrelevant one, a point I make in What Does Technical SEO Control on a Medical Website (and What Can’t It Fix)?.
Which Data Do I Trust: Lab Scores or Field Data?
Trust field data first. Field data comes from real patients’ devices, and it is what Google reports in Search Console.
The Core Web Vitals report in Search Console uses field data from the Chrome User Experience Report, over a rolling 28-day window, and it grades each URL group by its worst metric. Google explains this in its Core Web Vitals report help. A group with good INP and poor CLS shows as poor.
Lab tools, such as the Lighthouse score inside PageSpeed Insights, simulate one load on one device. They find causes. They do not tell you what your patients experience. A page can score 100 in the lab and fail in the field because real visitors run old phones on slow connections with your chat widget loading.
Use this order:
- Open Search Console → Experience → Core Web Vitals and note which URL groups fail and on which metric.
- Run one failing URL through PageSpeed Insights. Read the field-data block at the top first, then the lab diagnostics below it.
- Fix the metric that fails in the field. Ignore a lab metric that already passes there.
What Do I Fix First: LCP, CLS or INP?
Fix LCP first, CLS second and INP third, unless the field data says a different metric fails. Loading blocks everything else, and its fixes carry the least risk.
How Do I Fix a Slow LCP on a Clinic Page?
Find the LCP element, then fix whichever of its four subparts is oversized. On most clinic pages the LCP element is a hero photo of the building, a provider photo or a banner.
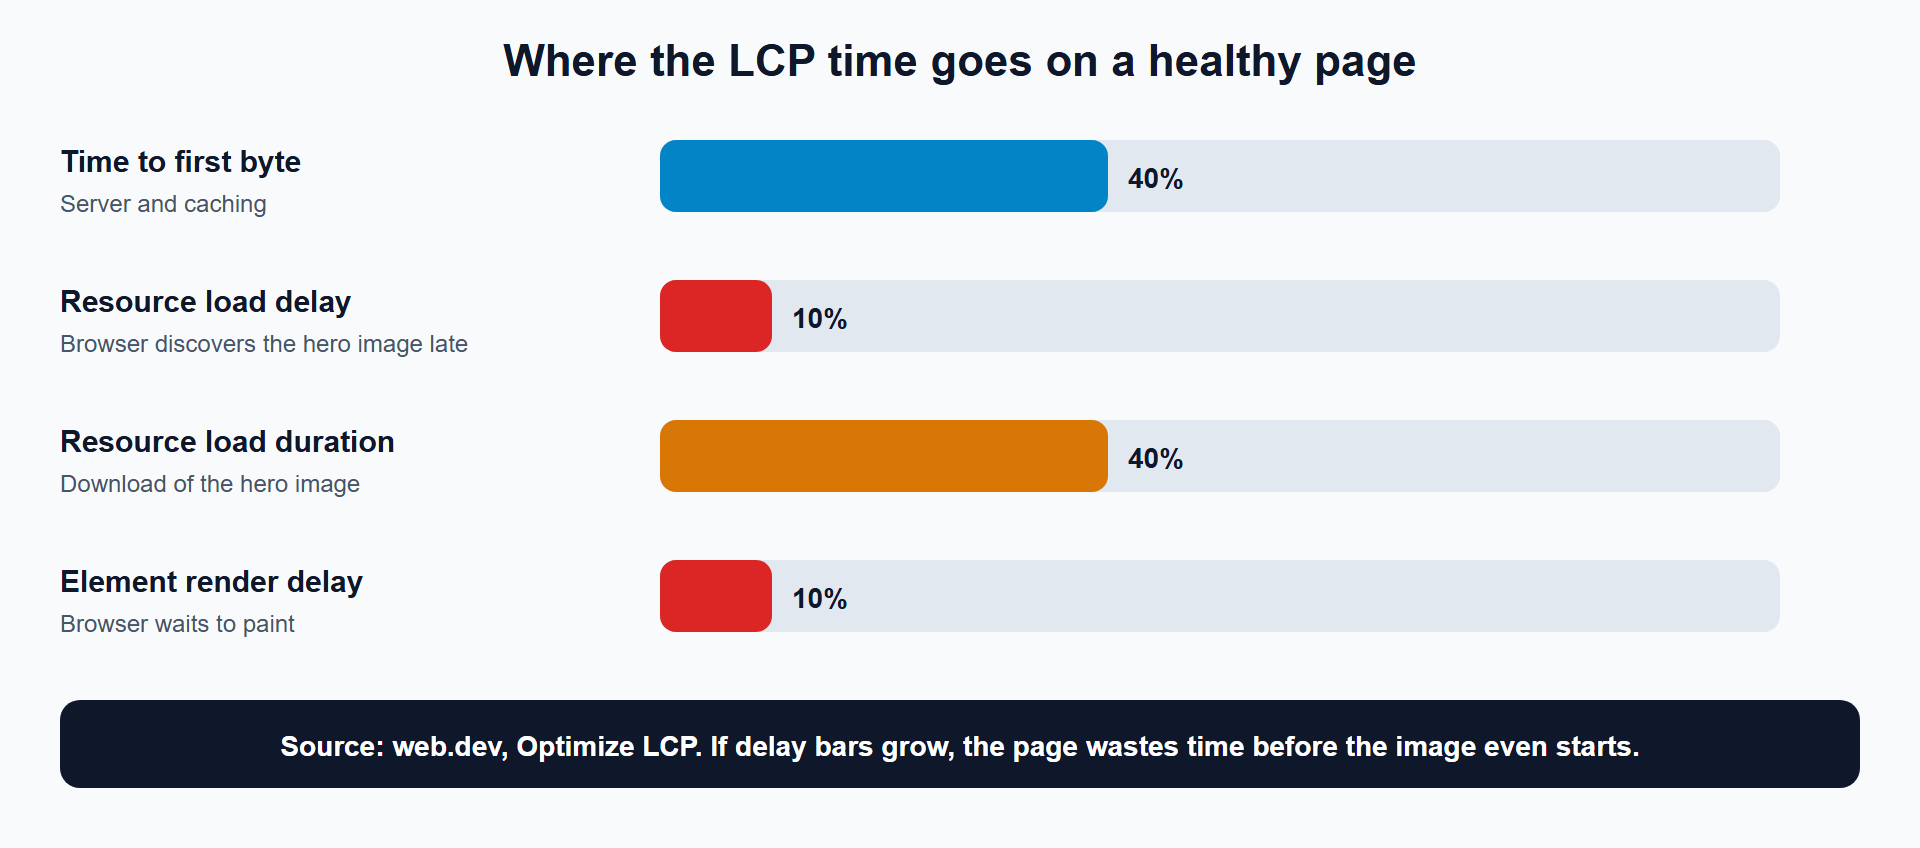
web.dev’s Optimize LCP guide splits LCP into four parts: time to first byte (about 40% of a healthy LCP), resource load delay (under 10%), resource load duration (about 40%) and element render delay (under 10%). Compare your page against that split. Large delay bars mean the page wastes time before the image even starts downloading.
The three fixes I apply first:
1. Raise the priority of the hero image and keep it out of lazy loading. web.dev says never to lazy-load the LCP image, because lazy loading always adds resource load delay.
<!-- Before: browser discovers the image late and may defer it -->
<img src="/images/clinic-front.jpg" loading="lazy" alt="Front entrance of Lakeside Family Clinic">

<!-- After: high priority, dimensions set, discoverable in the HTML -->
<img src="/images/clinic-front.webp" fetchpriority="high"
     width="1200" height="630" alt="Front entrance of Lakeside Family Clinic">
The fetch priority guide explains fetchpriority="high" in detail. Serve the image in a modern format at the size the layout needs. A 4,000-pixel-wide photo on a 400-pixel phone screen is the most common waste I find.
2. Make the image discoverable from the HTML. If the hero loads through a CSS background or a JavaScript slider, the browser finds it late. Put it in an <img> tag in the initial HTML.
3. Fix the server response. Time to first byte is about 40% of a healthy LCP. A slow WordPress database query or a missing page cache inflates it before any image work matters. The TTFB guide covers the causes, and I connect slow responses to crawling in TTFB Is a Crawl Budget Issue Before It’s a User Experience Issue.
How Do I Fix Layout Shift on a Booking Page?
Reserve space for everything that loads late: images, the booking widget, the chat bubble and fonts. web.dev’s CLS guide names the four usual causes: images without dimensions, embeds and iframes without dimensions, dynamically injected content and web fonts.
Give every image width and height, or use CSS aspect-ratio. Reserve space for the booking iframe:
<iframe src="https://scheduler.example/widget" title="Book an appointment"
        width="100%" height="640" style="min-height:640px; border:0"></iframe>
/* Reserve the widget's space before it loads */
.booking-embed { min-height: 640px; }
For fonts, preload the one or two critical font files and set a fallback so the text does not reflow when the web font arrives:
<link rel="preload" href="/fonts/brand-regular.woff2" as="font" type="font/woff2" crossorigin>
@font-face {
  font-family: "Brand";
  src: url("/fonts/brand-regular.woff2") format("woff2");
  font-display: optional;
}
web.dev lists font-display: optional as a way to avoid a re-layout, since the web font is used only when it is ready at first layout.
How Do I Fix a Slow INP on a Clinic Website?
Find which script freezes the page during a tap, and for clinics that script is usually third-party. Chat widgets, call-tracking snippets, review badges, tag managers and the booking widget itself all compete for the browser’s main thread.
web.dev’s Optimize INP guide points to three causes: input delay from busy scripts, long event callbacks and slow rendering after the interaction. The fixes, in the order I try them:
- Remove third-party scripts you do not use. Audit the tag manager. Old tracking pixels from last year’s campaign still run on every page.
- Load non-essential scripts after the page becomes interactive. A chat widget does not need to load before the page responds.
- Break up long callbacks. Hand control back to the browser between chunks of work so it can paint.
// Break one long task into smaller ones so the page can respond between them
async function processList(items) {
  for (const item of items) {
    handle(item);                       // small unit of work
    await new Promise(r => setTimeout(r, 0)); // yield to the main thread
  }
}
web.dev recommends this setTimeout pattern for splitting work in event callbacks.
What Can I Ignore Without Hurting Patients?
You can ignore chasing a perfect Lighthouse score, shaving a few kilobytes from CSS, and fixing lab warnings on metrics that already pass in field data. None of these changes what a patient feels.
| Task | Impact on real patients | Engineering effort | My call |
|---|---|---|---|
| Hero image priority, size and format | High | Low | Do first |
| Page cache and server response | High | Medium | Do first |
| Width/height on images, reserved widget space | High | Low | Do second |
| Remove unused third-party scripts | High | Low | Do second |
| Defer chat and tracking widgets | Medium | Low | Do third |
| Break up long JavaScript tasks | Medium | Medium to high | Do when INP fails |
| Minify CSS by a few kilobytes | Low | Low | Skip |
| Chase a Lighthouse score of 100 | Low | High | Skip |
How Do I Handle a Developer Who Wants to Optimize Everything?
Show the field-data report, name the one failing metric and agree on a single fix to ship first. Developers who propose 40 hours of CSS minification are not wasting time on purpose. Their tool listed 40 items and ranked none.
I ask three questions. Which metric fails in Search Console? Which element causes it? What is the smallest change that moves it? The answer is usually a hero image and a script, two tickets that take a day. Agree on a before-and-after measurement window, 28 days of field data, so the team sees the result in the same report that raised the flag.
What Do I Do This Week?
- ☐ Open Search Console and note the failing Core Web Vitals groups and metrics.
- ☐ Run the worst URL through PageSpeed Insights and read the field block first.
- ☐ Identify the LCP element and apply
fetchpriority="high", correct dimensions and a modern format. - ☐ Add width and height to every image and reserve space for the booking widget.
- ☐ List every third-party script. Remove what you do not use and defer the chat widget.
- ☐ Re-check field data after 28 days.
Reusable asset: the impact-versus-effort table above works as a fix-priority matrix. Copy it into your sprint planning.
Related reads in this hub:
Frequently Asked Questions
Why Does My Clinic Site Pass Lighthouse but Fail Core Web Vitals in Search Console?
Lighthouse simulates one load, and Search Console reports what real visitors experienced over 28 days. Real devices are slower, and real sessions load your chat widget, your tracking and your ads. Fix what field data flags.
Does Core Web Vitals Affect My Local Rankings for Patient Searches?
Google lists page experience as one set of signals its ranking systems reward. It does not lift an irrelevant page above a relevant one. For local patient searches, relevance, proximity and reputation lead, and fast pages remove a reason to lose the patient after the click.
How Long Until Search Console Shows My Core Web Vitals Improvement?
About 28 days. The Core Web Vitals report reads a rolling 28-day window of real-user data, per Google’s report help. A fix you ship today shows its full effect after the older data rolls off.
Do Mobile and Desktop Scores Count Separately?
Yes. Search Console reports mobile and desktop separately, and mobile fails more often because phones are slower and screens are narrower. Start with mobile, because most patient searches happen there.
Is My Booking Widget Hurting My INP?
Often, when it is a third-party script. Test by loading the page with the widget removed and comparing INP in PageSpeed Insights or Chrome DevTools. If INP improves sharply, ask the vendor for a lighter embed or load the widget only when a patient clicks “Book.”
Do I Need a CDN for My Clinic Website?
A CDN speeds up static files and, with HTML caching, the server response for patients far from your host. It helps most when your audience spans several states or your time to first byte is the largest LCP subpart. A single-location practice with a fast host gains less.
Facing unexplained indexation drops or broken booking funnels on your clinic website? Book a 30-minute technical consultation with Atiur.
Part of the Technical SEO for Healthcare Websites series. More guides are on the blog. Related case study: Multi-location orthopedic practice: 3.8x patient bookings via Map Pack.
References
- web.dev, Web Vitals
- web.dev, Optimize Largest Contentful Paint
- web.dev, Optimize Cumulative Layout Shift
- web.dev, Optimize Interaction to Next Paint
- web.dev, Fetch Priority API
- web.dev, Time to First Byte
- Google Search Central, Core Web Vitals and Google Search
- Google Search Console Help, Core Web Vitals report
- PageSpeed Insights, pagespeed.web.dev